Living Synthesis
02 Apr 2020We live in a world full of engineered sound. Specifically in music, with technologies such as MIDI and workstations like Ableton and Melodyne, it has become the norm to listen to fully digitally synthesized sounds. Even when mimicking acoustic instruments, these synthesized sounds often feature very little sampling of live recordings. For some, this might be a bit artistically unsettling.
In my computational audio course at school, as an introduction to the concept of timbre, the professor rhetorically asked “why do different instruments sound different even when playing the same note”. Although I’ve played music nearly my entire life, I was surprised to realize that I had never really asked myself this. Connecting this idea to the abundance of digitally synthesized acoustic sounds, I wanted to make a project to explored this. The mission of the project is to synthesize instrument sounds derived from real audio input. I.e. take a recording of a real instrument and synthesize it into sounding like another instrument. While the resulting audio is still digitally made, in some sense there would still a bit of “real” instrument audio left in it, making it more “alive”.
This is a heads up that this is going to be a fairly long read so if you want a TL;DR, here it is:
man…. that was difficult
Table of contents:
- A bit on digital audio as a whole…
- Setting the scene
- Approach 1
- Approach 2
- Problem 1
- Problem 2
- And then…?
- Other notes
- Final remarks
A bit on digital audio as a whole…
Digital audio is definitely not the most ubiquitous topic people are familiar with. I’m going to try to use layman’s terms where I can but there are definitely a few conceptual things that need to first be defined.
Sound can be generally thought of as a wave. Some people might think of a sin wave when thinking about how sound is digitally stored. Mathematically, a sin wave is continuous meaning that it is expressed by some continuous function that has an infinite number of points in it. Digitally however, sound is stored as a set of discrete points. This means that while yes, sound could be a sin wave, instead of storing the mathematical function of sin, it is digitally stored as a bunch of individual points that if you played connect the dots with, would form a sin curve. These individual points are called samples and each stores a value that is used to map it on a time-amplitude domain. Samples are evenly spaced horizontally and the density of them is determined by the audio bitrate which is usually 44100. This means that there are 44100 samples in one second. So in just one second of audio, there are 44100 points which can be plotted to form the “curve” of the sound wave.
In terms of the amplitude, for the sake of this project discussion, I normalized everything between 0.7 and -0.7 (dBFS where 1.0 and -1.0 is a maximumally saturated signal and 0.0 is no signal) meaning that all samples have a numeric float value between 0.7 and -0.7. I did this because after a few failed experiments at the start, I nearly blew my eardrums out when listening to something that got scaled up to the 100’s in amplitude.
Setting the scene
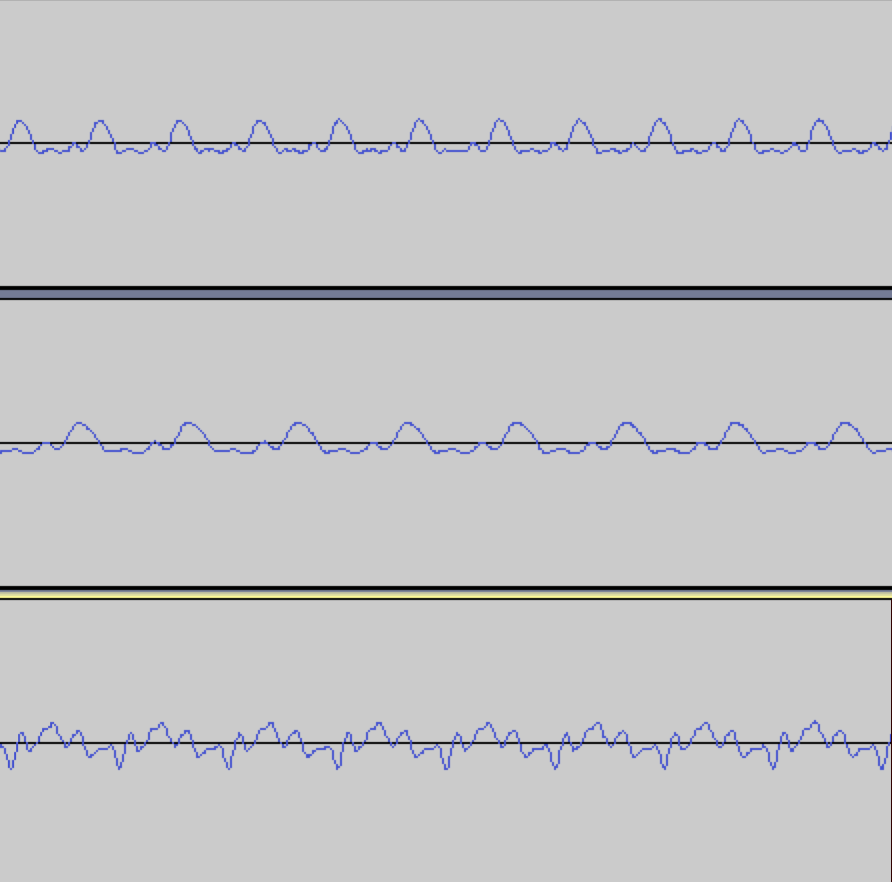
I picked two instruments that I wanted to synthesize from one to another. I ended up picking the violin and flute for a few reasons. An instrument’s unique sound (aka timbre) is largely defined by its particular musical envelope. This musical envelope is determined by a lot of things such as overtones as well as the physical mechanics of the particular instrument. All together, it forms the “shape” of the waveform. The flute and violin’s respective musical envelopes are already fairly similar which will make the synthesis from one to the other a little bit more natural. As well, neither instrument’ envelopes contain any particularly distinctive elements that are instrument specific and deviate out of generic musical envelope patterns.
I used the Musical Instrument Database by the University of Iowa to obtain clean recordings of a flute and violin playing a C5 note for about 1-2 seconds each. I loaded up a blank Python (Jupyter) notebook and I was all set to begin writing software that would take the two recordings and hopefully produce a flute sound synthesized from the violin recording. Ideally, the techique could be applied universally for all violin notes (without needing a different flute recording for each one).
Note: All recordings in this blog post have been compressed for web. If you would like to take a look at the original files, feel free to email me.
Approach 1
Terminology:
- source - the sound we want to modify, i.e. the violin
- destination - the sound we are comparing the source to and want to make the source sound like, i.e. the flute
- scaleFactor - to be defined below
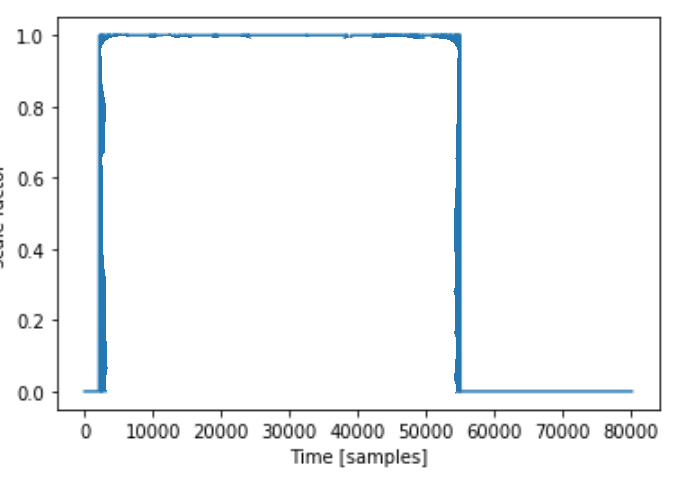
My first approach was very naive and had moderate success. I would pass in the source and destination recordings to come up with a scaleFactor array. The scaleFactor array kept track of the ratio between each source and destination sample value. For example, at the 800th sample, if the source had a value of 0.25 and the destination had a value of 0.50, then the scaleFactor array at 800 would store the value of 2.0 since that’s what the source sample would need to be multiplied by to match the destination sample.
Since the source and destination did not have the exact number of samples, I used some ratios to figure out which destination sample to compare each source sample to. For example, 800 x R is where to look for the “800th” sample of the destination if R is the ratio between the number of samples in source and destination)
Using this scaleFactor, I would then pass through source and apply the adjustment scale on each sample.
output = [(sample*scaleFactor[i]) for i, sample in enumerate(source)]
When I first listened to the synthesis above, I nearly jumped out of my chair. It wasn’t the garbled mess I was expecting, it actually sounded like a flute/woodwind, it worked! Or did it…?
The first thing that immediately stuck out to me was that the actual note had now changed. It was no longer a C5 but something just shy of F#5 (~720Hz). When I compared the waveforms of the source, destination, and output, it was definitely clear that the wavelengths of the output’s waveform had dramatically shrunken resulting in the higher pitched note (since shorter wavelength -> higher frequency). It was also clear that the resulting audio had a waveform more similar to the flute than the violin, as desired.
Before I dug deeper into resolving my issue with changing pitch, I did some more experimentation. I tried using a violin E4 note for the source input and kept the same flute C5 as the destination input. The resuling audio also sounded like a woodwind but yet again, the pitch had now altered from E4 to a very flat A#4~453Hz. It was noteworthy to see that the pitch alteration was fairly similar between using a C5 and an E4 source (something close to an ascending diminished 5th interval).
The next test was a more important one, would a scaleFactor produced from two sounds work for a separate third sound? For example, could the produced scaleFactor between the violin C5 and flute C5 work on a violin E4 to produce a flute E4? If this was true, then we could produce many scaleFactors between various pairs of violin and flute notes, find an average, and thus end up with a “universal” violin to flute scaleFactor. I changed the code so that when applying a scaleFactor onto a wave, it didn’t assume that the length of the scaleFactor matched the length of the source wave’s since it could have been produced from two other sounds. I used the same method as the process for generating the scaleFactor between two sounds with different lengths by using ratios in order to make sure that the scaleFactor was applied across the entire source file.
output = [(sample*scaleFactor[math.floor(ratio*i)]) for i, sample in enumerate(source)]
Unfortunately, despite this, the results were disappointing, every combination I tried would just result in staticy noises. Looking at the waveform showed a bunch of nonsensical ups and downs and no clear wave shape.
I also tried giving the program a flute playing C5 but with vibrato as the destination file. The output note also had vibrato despite the source note not having any. This seemed to go against the spirit of this project as a whole. The intention was to synthesize the “sound” of the destination instrument but maintain the characteristics of the source’s. It seemed like things had been flipped and the destination file was the dominant driver in the output sound. I thought about it some more and it made sense why the output had inherited the vibrato from the destination file.
Whatever the program got as a destination file, it would blindly try to make the source file sound like it. This frankly obvious realization helped me realize why the pitch had been changing as well. Because the two notes being used to make the scaleFactor were different lengths, I had to use ratios to make the samples line up. For example, if the violin only had 10 samples and the flute had 20, every violin sample was being compared with every other flute sample. This was effectively compressing the waveform of the flute that I was comparing to the violin. And by compressing the waveform, the wavelength got shorter and the frequency went up. To verify this theory, I ran the program again but with a violin C5 recording that was longer than the flute recording. Sure enough, the outputted recording had shifter lower. This is because in the case where the violin recording is longer, instead of compressing the source file, it elongates it, effectively reducing the frequency, resulting in a lower note.
scale = np.zeros(sourceSamples)
ratio = destSamples/sourceSamples
scale = [0 if source[i] == 0 else dest[math.floor(ratio*i)]/source[i] for i, sample in enumerate(scale)]
(^ where the problem comes from)
After some deliberation, I realized that an entirely new approach was needed to resolve the problems of changing pitch and the restrictiveness of each generated scaleFactor.
Approach 2
Recall that I purposefully chose the violin and flute due to their similar musical envelopes. Introduce the Attack, Decay, Sustain, and Release (ADSR) model. A musical envelope is usually categorized into these four phases of a note’s lifespan. Each phase has a general repeating waveform and all combined, it makes up the total note. I also noticed that the characteristic wave of each phase of the note remained largely unchanged across different notes of the same instrument.
I figured that if I was able to find a universal transform function from a single violin sustain waveform to a single flute sustain waveform and then smartly apply this transformation across the entire sustain of the violin, then I would find some success. If that seemed to work, I could do the same for the attack, decay, and release and end up with a more complicated but smarter procedure. I chose to start with the sustain since it is the longest part of the note.
Analytically finding these different phases of a general musical envelope is a very challenging problem on its own so I had to make shortcuts. Since my violin and flute recordings largely consisted of sustain, it wasn’t too hard to eyeball a snippet in the middle that was definitely somewhere in the sustain portion of the note. From there, I wrote a procedure to isolate a single wavelength and output it as a separate file.
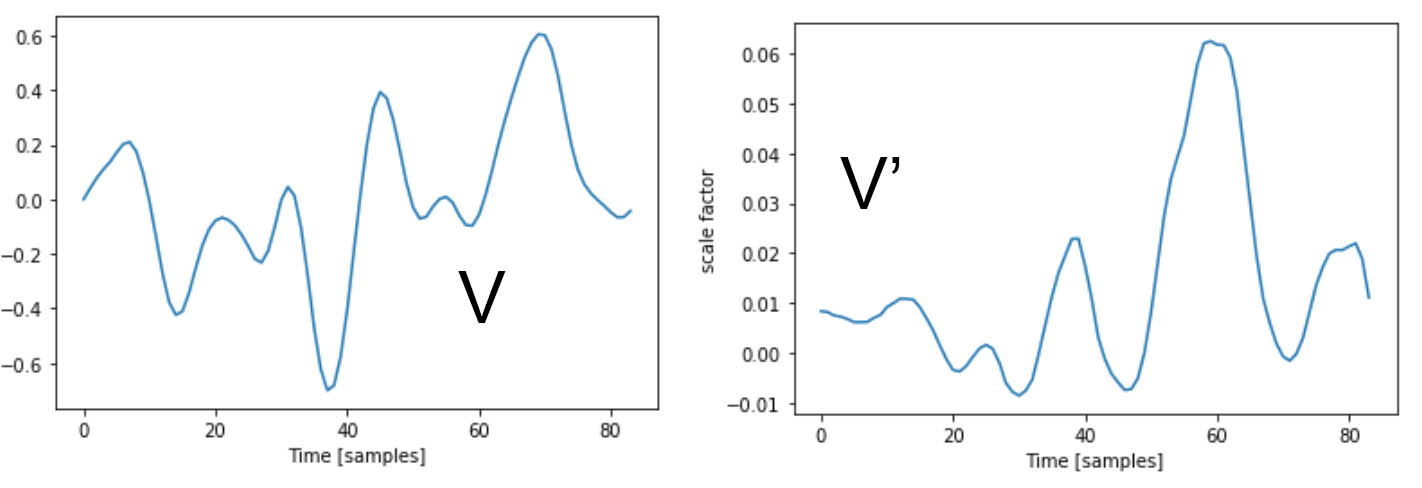
The process for this wasn’t too bad actually. Given that I knew the sample rate of the file and the approximate note it was supposed to be, I could ballpark the number of samples that made up a single wavelength by dividing the sample rate (44100Hz) by the frequency of C5 (523.25Hz). That gave me 84.2 so I knew the wavelength was around that number of samples (since the note is played by a human, it is not going to have a frequency of precisely 523.25). From my small snippet of the sustain, I found the first sample that crossed the x-axis (or at least was very close to 0). From that sample, I looked at the next 84 + (error threshold of 2) samples and found the last sample within this range of 86 values that also was very close to 0 (within 0.02). I then knew that this last point would be the end of my wavelength. I performed this for both my violin and flute sustains and extracted the following single wavelengths.
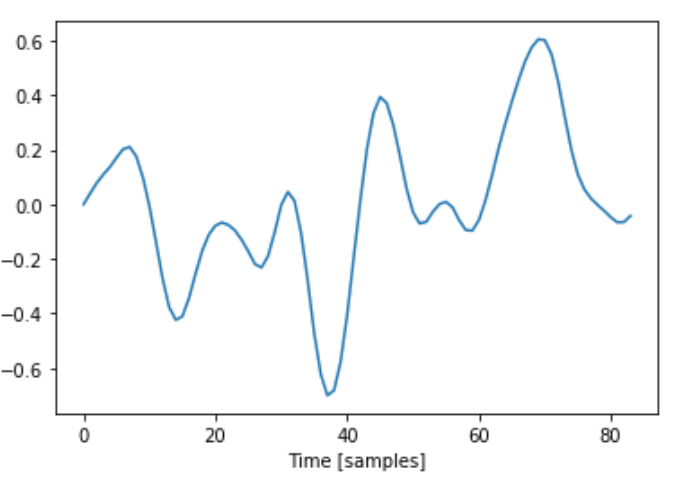
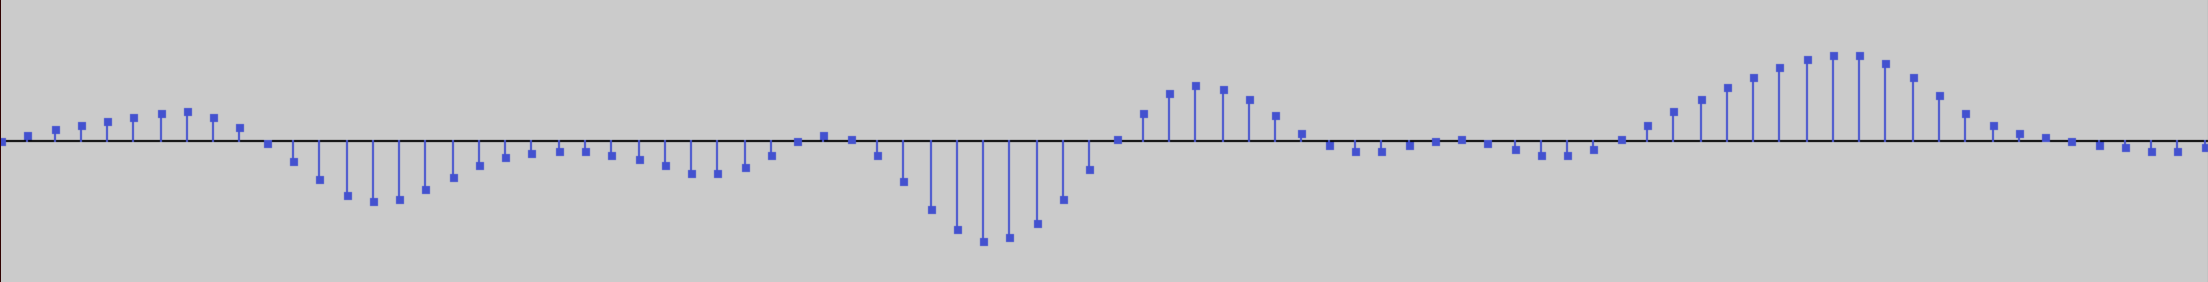
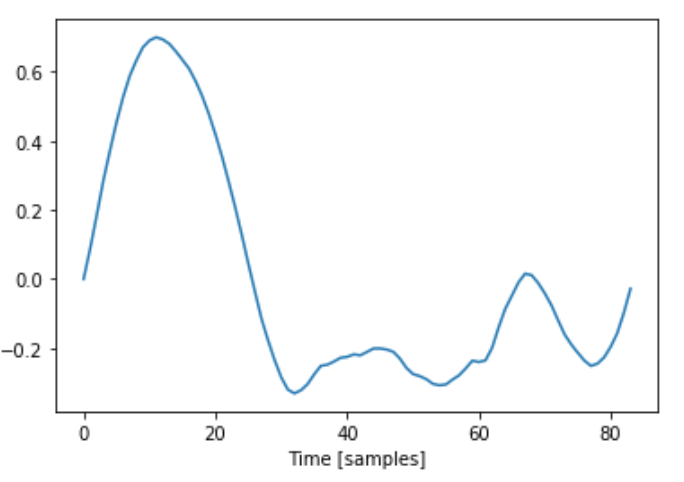
Both single waves ended up being 84 samples long.
Now that I had these sustain patterns isolated, I had two tasks to do:
- The first was how to transform the shape of the violin wave to the flute wave
- The second was how to identify where I needed to apply this transform function on a full violin note
Spoiler alert. Unfortunately, here is where I reveal that I was unable to get successful solutions to either of these problems (well at least for now, I am not calling quits on this project forever). Despite the outcome, I still think that there are learnings from the process worth sharing and I’ll also speculate on why I was unable to find the success I was looking for.
Problem 1: How to transform from the violin wave to the flute wave
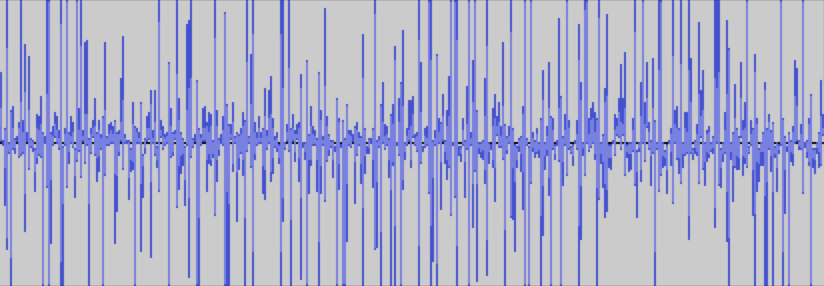
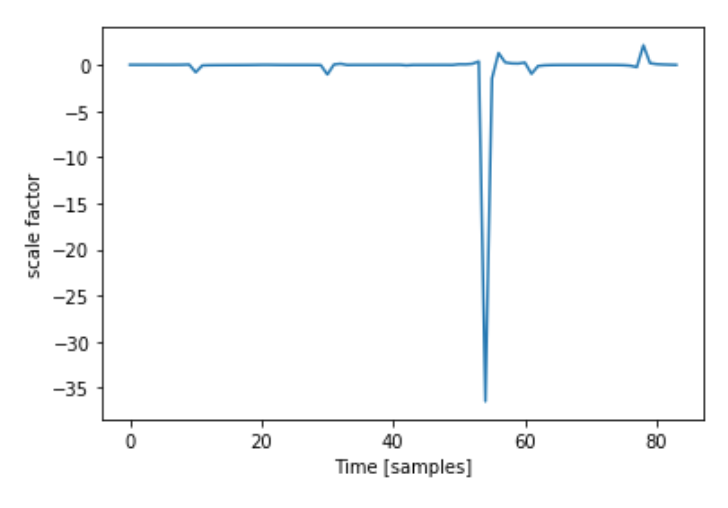
Just like my approach #1, I created a scaleFactor that was simply the element-wise division of the flute samples, F and the violin samples V. Let’s call this scaleFactor S. Here is the S I got from the violin and flute waves I found above:
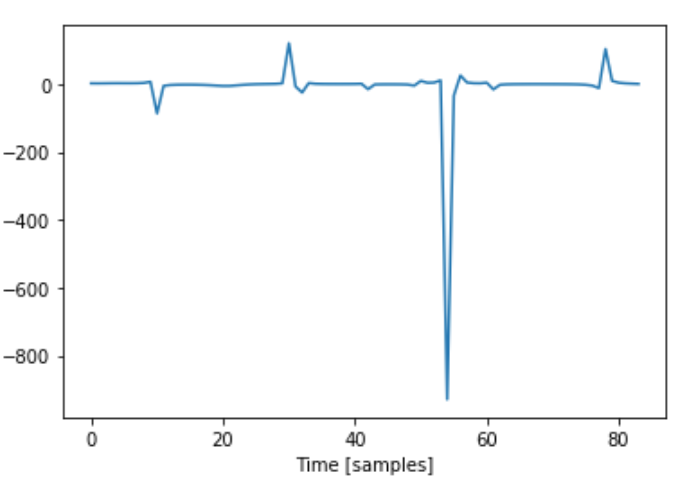
I immediately noticed the huge downward spike that reaches past -800. This happens when V is very close to 0 from the positive side and F is around -0.2. Because the violin sample value is extremely small, when dividing F[i] by V[i], the result was a huge number.
The thing is, no two waves are exactly the same since they are played by a living human. i.e., I needed scaleFactor, S such that S x V = F but also that if V’ was a similar waveform to V, then S x V’ is similar to F. The huge downward spike in my S was extremely specialized to my specific V that I made it with. If a similar waveform, V’ was slightly shifted left or right compared to the original V, then the extreme peak in S wouldn’t align to where V’ was also close to 0 and S x V’ would create something far off from F.
To complicate things, in order to find a V’ to test my S with, I needed to have a working solution to my 2nd problem of finding where to apply S in a longer violin recording. Trying to compare S x V’ with F was very disorienting with these two moving parts because I was constantly asking “does my S need to be better or is the V’ I’m using too different from V and I need to tighten my search parameters?”. This extremely frustrating experience of dealing with coupled problems and trying to sequester things apart from another is definitely one of the most important lessons from the overall project.
Problem 2: How to figure out where to apply S
My strategy to find snippets of the longer violin recording to apply S was essentially a sliding window problem. Instead of looking for subarrays of the larger recording that were exact matches to V, I needed to find subarrays of 84 samples length that were similar enough to my original V. After a few attempts at this, I quickly noticed one pitfall I had to avoid - I call it the misalignment problem.
The original V was made from a repeating signal. There’s no marked “start” of each wavelength, I arbitrarily picked one by finding one of the x intercepts. The same goes for F. As such, the resulting S was made to fit the violin signal only at specific intervals.
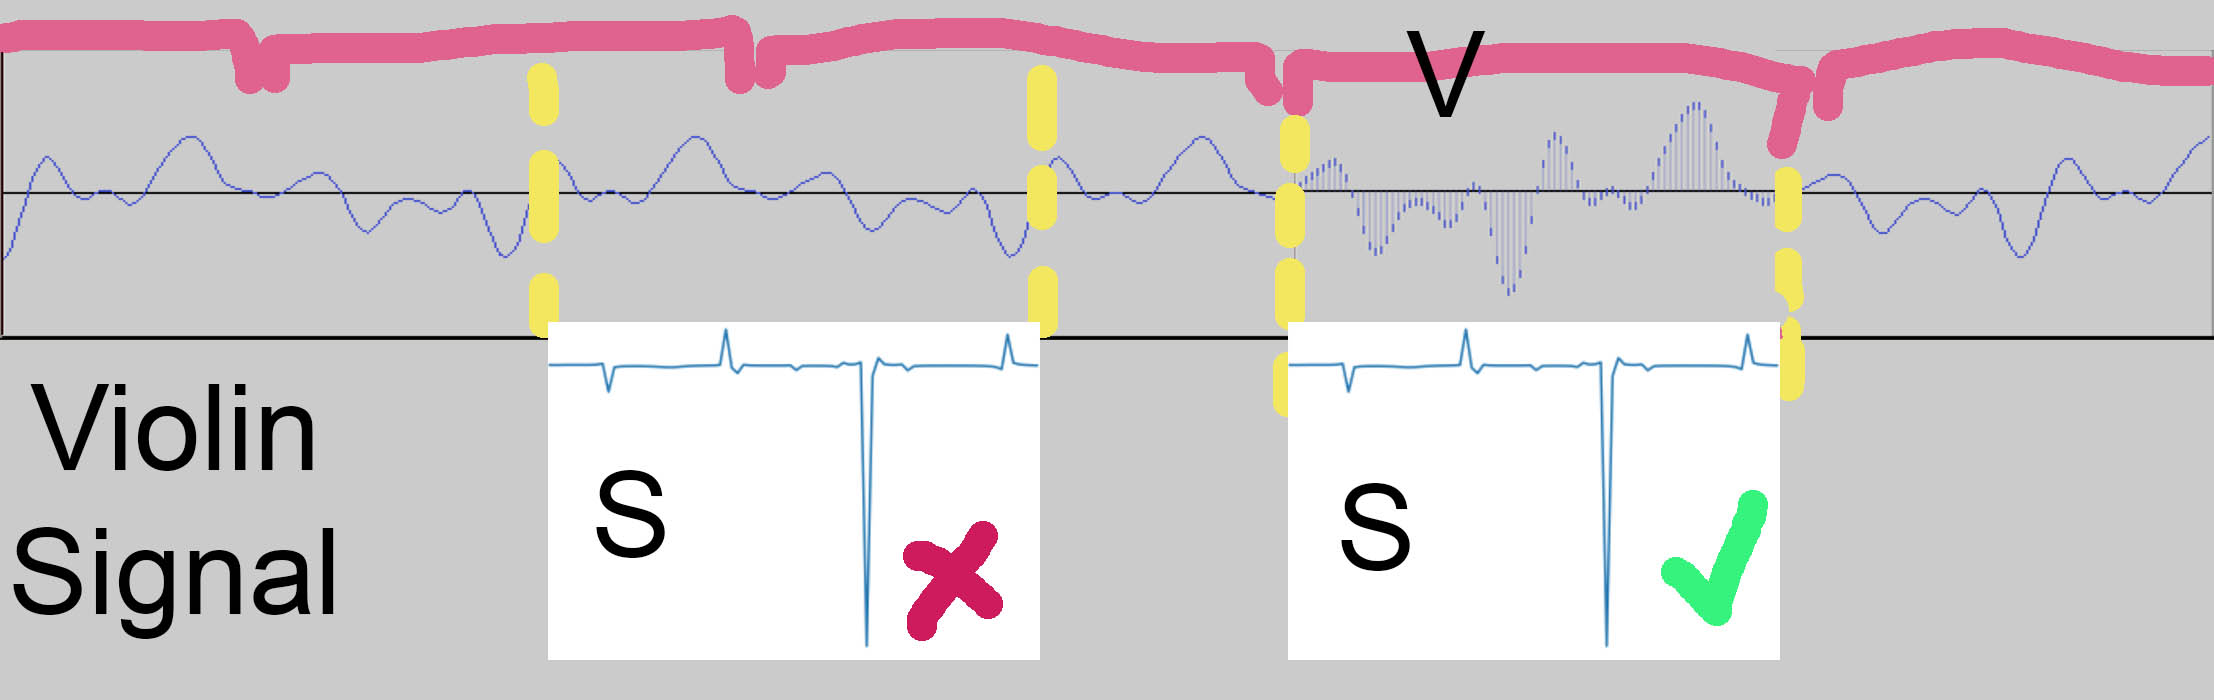
If S is applied onto the signal at a “wrong” spot, it won’t work well since it is being applied on something that isn’t close enough to the original V (think of how a key is designed for a particular keyhole). It was very important that my scanning algorithm was able to tell where the “starts” of each V were and didn’t instead return a spot in the “middle” of a wave.
To characterize my V, I took note of the fact that it starts and ends very close to 0 and that it has 6 local maximums. I stored the number of samples between each of the 6 local maxes. With the sliding window algorithm, with every window, it checked if the window also started and ended close to 0 as well if the window had 6 local maxes spaced out similarly to how V’s were (I gave it a +- 5 sample leniency for each peak to peak distance).
I kept track of how many matches the algorithm found in the original Violin C5 recording and the results varied from only a few hundred to a bit over a thousand depending on how I set the leniency threshold of my matching algorithm. For reference, 1 second of sustained a C5 note should get 523 matches since that is the frequency of the note.
To get a better analytical look, I set the sample value to 1 for any matches, so that I could easily visually see the places that the algorithm didn’t identify as a match.

From analyzing this data, I found that the variations from wave to wave were greater than I predicted. For example, the 5th peak in my V sometimes didn’t exist and because of that, the matching algorithm skipped it. To accomodate for this, I added a “missing peak” condition so that the matching algorithm also accepted windows with only 5 peaks where the distance between its 4th and 5th peak matched the distance between the distance between V’s 4th and 6th peak.
To get an overhead look, in addition to setting the sample to 1 if it matched, I set everything else to 0 so that I could see a general look on where it was matching.
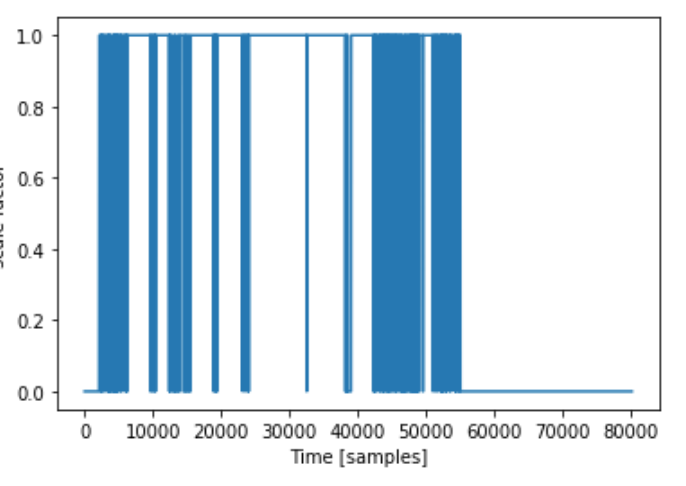
While my results weren’t what I think an ideal case would look like, upon further investigation, the graph looks worse than it is just because of the scale of it. If often only missed a handful of wavelengths but that still shows up on the graph as a noticeable vertical blue block.
And then…?
In the end, putting together my S and my wavefinding algorithm, I ended up with a result that needless to say, does not sound anything like a flute. It is attached below (warning, it doesn’t sound nice so lower volume/take off headphones).
For now, I am stumped on how to proceed. I feel like the main issue lies in finding an S that works for V as well as the (wide) range of variations, V’. The wave finding algorithm is definitely not perfect but I think it’s alright enough so that if I had a better S, the output would sound much closer to a flute than what I got out.
Other notes
Here are a few other notable things that I couldn’t find a way to narratively fit in earlier.
- I also tried calculating S using an additive method meaning that V + S = F instead of V x S = F. This didn’t really work due to the fact that the scale of the V waveform is related to how loud it is played. It results in an S that is even more specialized to the specific V used.
- I also tried to interpolate S using a variety of methods in order to obtain a “smoother” function. The best result I got was from using a Savitzky-Golay filter but even this still ended up in erratic outputs
- In a perfect world, had I been able to get approach #2 to work, it would have enabled for the universal synthesis that approach #1 was missing. This would have been done by either compressing or stretching F to match V’s length when calculating S. This would have changed F’s wavelength to match V’s so that the violin wouldn’t have its pitch adjusted but still would have taken on F’s waveform
- I remain curious on how a fully working procedure would have held up with a different range of notes. For example, a violin playing its highest note has a very different timbre than its lowest note due to the physics of the instrument (higher position on the fingerboard results in a shorter string). I wonder what role this would have played in developing a more complete solution
- Vibrato. Both instruments can do it but would there have been a way for a vibrato violin recording to become a vibrato flute recording only using a nonvibrato flute base to model off of?
- My proposed approaches only work on single notes. The idea would be that if I wanted to convert a full piece/song, I would isolate the individual notes and apply the procedure on each one. However, in practice, music isn’t just a series of notes being played, especially for a nonfretted instrument like the violin. Notes can blend into each other, have ornamentation, or other articulations. What kind of challenges would arise from trying to apply the procedure for single notes on to a larger continuous musical work? How would effects like glissandos or double stops be treated?
Final remarks
If you’ve made it this far, give yourself a pat on the back. This is definitely a long read and really my first crack at technical writing. While I am for now stumped on this research project and putting it on pause, this by no means suggests that I am done with this forever. Whether you see obvious problems in my method, have ideas on how to continue, have questions, or just want a look at my awfully messy Jupyter notebook/python code, please reach out! You can email me at nickxie.me@gmail.com. This is a project that I am passionate about and if you want to contribute to it, I’d be more than happy to have you.
For this blog post though, I’ll have to end it here and thank you again for reading this far (or for just scrolling to the bottom of the page, high five to you as well). Cheers!